The technical developments:
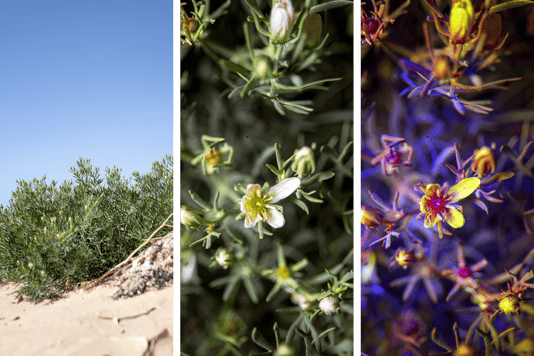
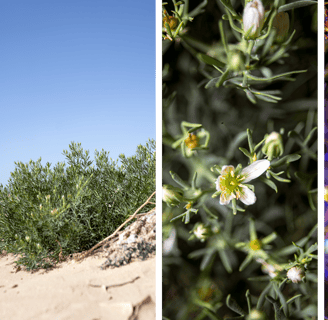
Photography: Last year, we further developed several photographic techniques within the infrared and UV spectrum. Non-human life often literally sees the world differently from humans. For example, many non-human entities can observe the ultraviolet spectrum or infrared where colours from the human light spectrum are sometimes not seen. For example, some snakes are known to hunt in the dark by sensing the heat emitted by their prey, they convert heat into a thermal image. Different kinds of insects, like bees for example, see the world very differently because of differences in the combinations of photoreceptors in their eyes, with peak sensitivities in ultraviolet (UV) and/or blue and green and often not in red parts of the spectrum. By adding the perspectives of non-human entities and allowing them to become part of the A.I. input, new insights about landscape design emerge.
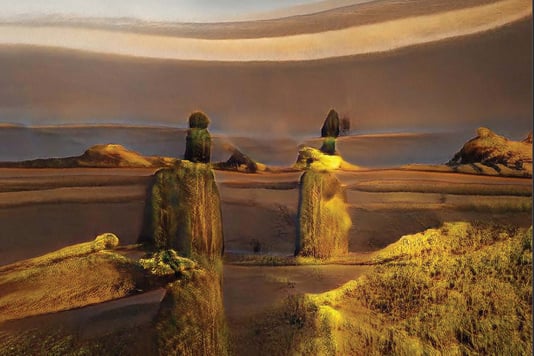
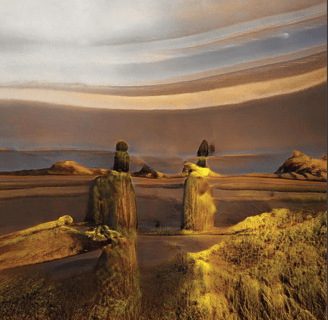
Machine learning The basis of our current datasets is photo-driven. An image of an open grain field belongs to the harrier, an image of a hollow tree may belong to a polecat. In this way, we create datasets per stakeholder to feed the A.I. machine in order to render landscapes as visual stakeholder analysis for different species. In the next version, we also want to add complex abstract data when visualizing a landscape. We want to develop a smarter and better-trained A.I. in which we can insert complex abstract data when visualizing a landscape, for example: policy frameworks, political realities, soil and water quality, carbon and nitrogen emissions. A dot on the horizon for further development is that the “New Horizon Initiative” method can help policy makers with drawing scenarios in which can be visualized what the consequences are of certain decisions on non-human life.
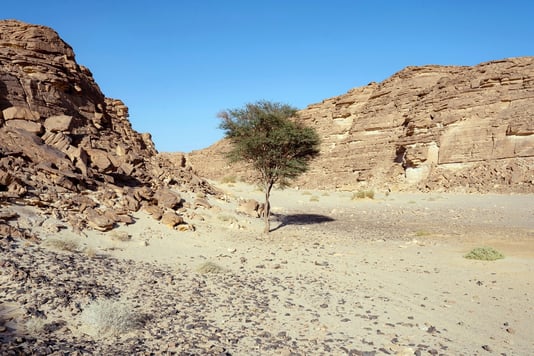
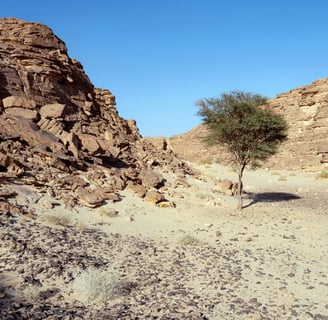
Using the traditional medium of photography to make a typological survey of an environment. The characteristics which we take into account are indicative of the needs of the non human life stakeholders. Typically arriving at a location several weeks in advance shooting over 10,000 images.
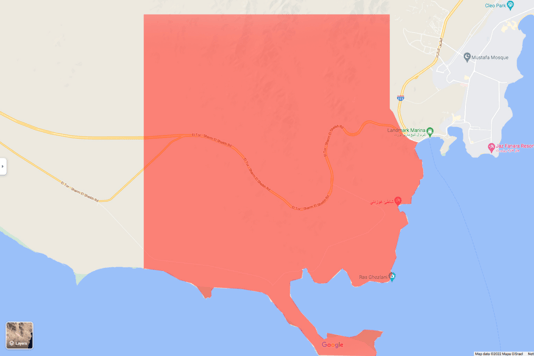
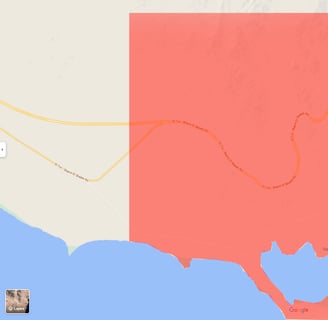
Scholarly research: Abstract data, GIS charts.